The CSI equation was modified to account for the distinction between alpha and 3,10 helices as follows:
if fab > 0 and fao < 0
F = (fab2 + fao2)/2
else if fab < 0 and fao < 0
F = -[(fab2 + fao2)/2]
else if fab > 0 and fao < 0
if |fab| > |fao|
F = (fab2 + fao2)/2
else if |fab| < |fao|
F = -[(fab2 + fao2)/2]
else if fab < 0 and fao < 0
if |fao| > |fab|
F = (fab2 + fao2)/2
else if |fao| < |fab|
F = -[(fab2 + fao2)]
where
fab = Ca ss - Cb ss (ss = secondary shift)
fao = Ca ss - CO ss
CSI for residue i = 0.25*(Fi-1 + 2*Fi + Fi+1)
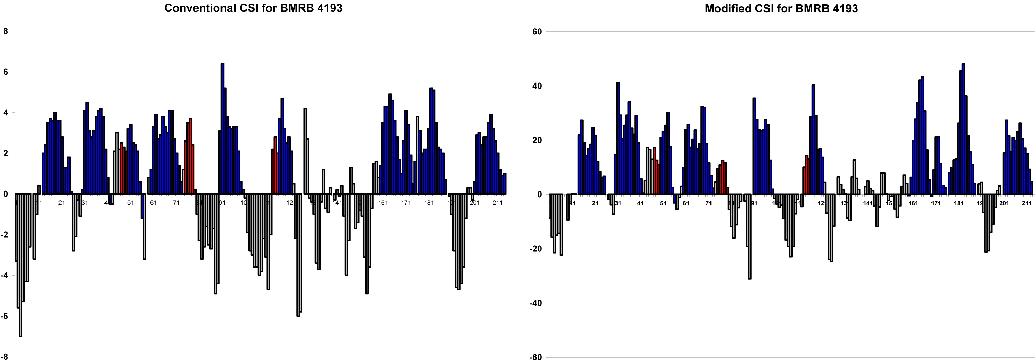
accession # 4193 (X-ray 1AKE)
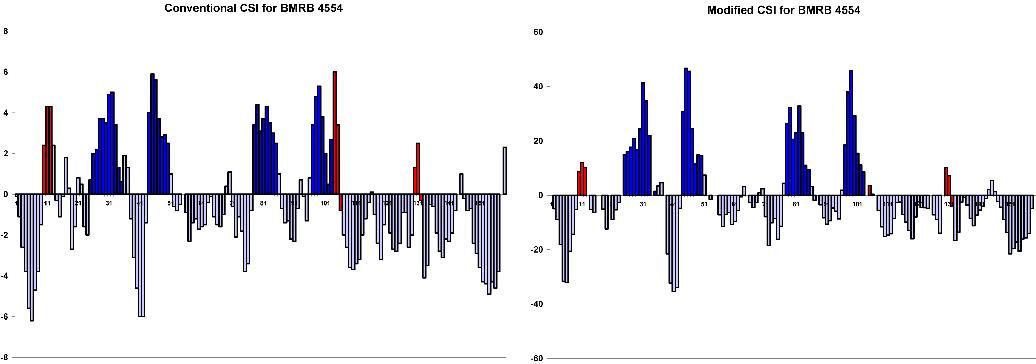
accession # 4554 (X-ray 1RA1)
accession # 4836 (X-ray 1HAV)

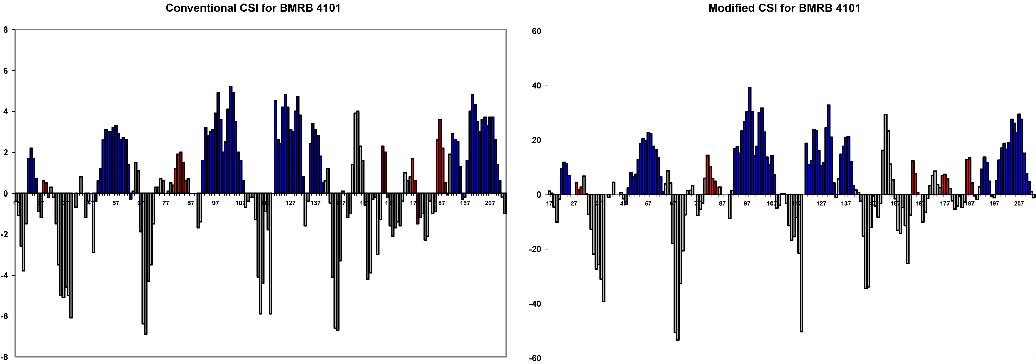
Conventional and modified CSI plots for the above BMRB entries were compared to the PROMOTIF calculated secondary structure for the corresponding X-ray structures. In each CSI plot, alpha helices are shown in blue and 3,10 helices in red. Note that alpha helix maximum CSI values are systematically lower than those for 3,10 helices, providing a better distinction between these subclasses.
False positives in the CSI plot were typically localized to beta turns
(see section 4).
accession # 4267 (NMR 1NGL, X-ray 1DFV)
| Residues | X-ray | NMR | modified CSI plot |
| 13-15 | 3,10 | 3,10 (14-16) | 3,10 (13-16) |
| 25-28 | - | alpha | 3,10 (25-27) |
| 146-158 | alpha | alpha (149-161) | alpha (147-159) |
| 163-165 | 3,10 | - | 3,10 (163-166) |
| 176-178 | - | 3,10 | - (end of protein) |
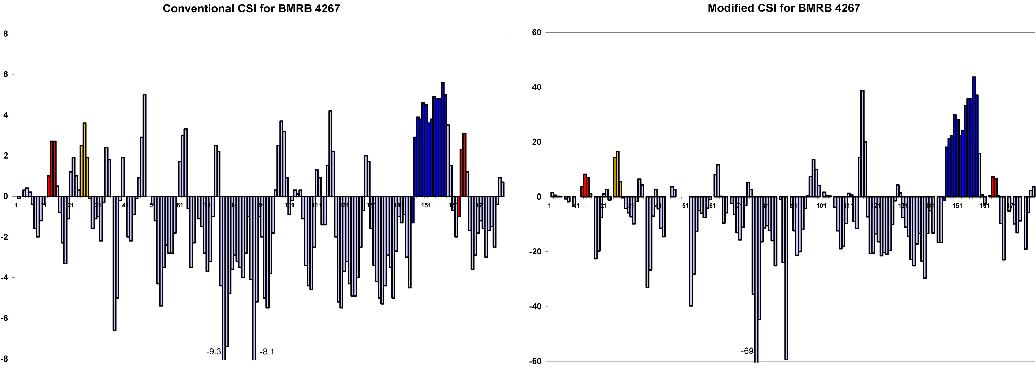
Yellow bars highlight the helical region (25-28) designated as 'alpha'
in the NMR structure, but not identified in the x-ray structure.
| Residues | X-ray | NMR | modified CSI plot |
| 16-32 | alpha | alpha (17-32) | alpha (16-20, 23-31) |
| 38-45 | alpha | alpha | alpha (38-46) |
| 86-88 | 3,10 | 3,10 | 3,10 (85-87) |
| 93-107 | alpha | alpha (94-107) | alpha (93-109) |
| 122-127 | alpha | alpha (119-128) | alpha (122-127) |
| 138-141 | alpha | 3,10 | 3,10 (138-140) |

Purple bars highlight the final helix (residues 138-141) which is designated
as alpha in the x-ray structure, but 3,10 in the NMR structure. The
CSI plot suggests it is a 3,10 helix.
In applying the modified CSI to a protein for which both NMR and x-ray structures are available, it is shown that secondary structure prediction is generally consistent with secondary structure defined by the crystal structure. In the case of BMRB # 4321, the CSI and NMR data (PROMOTIF definition) agree on the subclass of helix which differs from the x-ray structure's PROMOTIF definition. However, breaks in helices and magnitude scaling issues indicate an optimal CSI equation has not yet been found (currently under development).