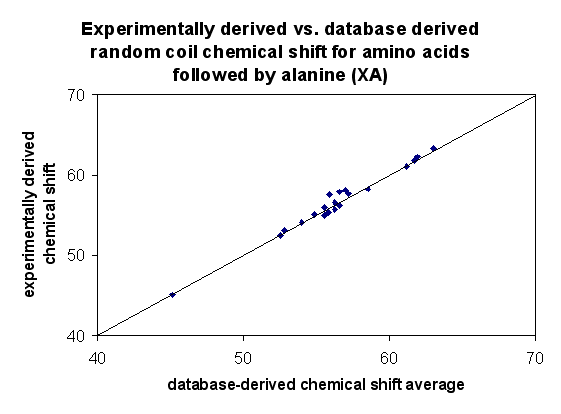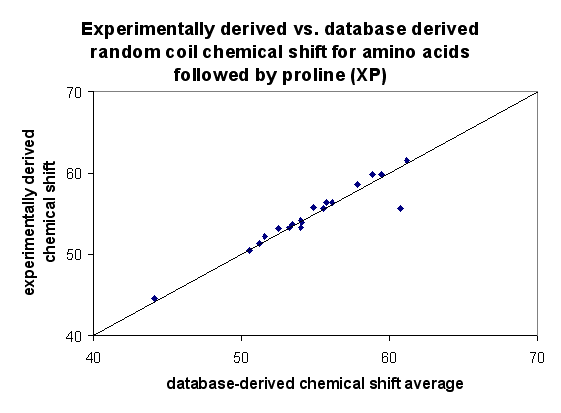

Comparison of random coil values against those published by Wishart and Nip (1998)
As seen in the plots against previously published data, the database
derived random coil shift averages compare best for N, Ca and Cb.
Normalizing these values somewhat improves the linear correlation of the
Ha and C' shifts. It is unclear why the amide proton (NH) shifts
differ so visibly from the values of Wishart and Nip, although for 14 amino
acids, this difference is less than 0.1 ppm.
The chemical shift averages shown are for residue i, which are listed in columns. The first number is the chemical shift average value, the second number is the standard deviation, and the third is the number of shifts contributing to the average. Only those values determined by Student's t-test to be statistically significant in difference from the overall average for that amino acid is shown.
A residue i that has a column of filled values indicates an amino acid that is especially prone to neighbouring effects at the i-1 position. A nearly complete row of values would indicate that that particular amino acid at i-1 exerts a strong influence on the amino acid at position i. In summary:
| preceding residue i-1 | affected shift type | affected amino acids (i) |
| G | NH | A, B, E, F, G, I, K, M, Q, R, T, V, Y |
| A | N | A, B, D, E, F, G, H, I, K, N, R, S, T, V |
| I | N | A, D, E, G, H, I, K, L, M, N, P, Q, R, S, T, V, Y |
| P | N | A, D, E, I, K, L, N, Q, R, S, T, Y |
| T | N | A, B, C, D, G, I, K, L, N, R, S, T, V, W, Y |
| V | N | A, B, D, E, G, H, I, K, L, N, Q, R, S, T, V, Y |
| affected residue i | affected shift type | influencing amino acids (i-1) |
| A | NH | A, B, D, G, H, I, K, P, Q, S, V |
| A | N | A, C, E, G, I, L, M, N, P, T, V |
| D | N | A, B, D, E, G, I, K, M, P, T, V, Y |
| G | N | A, B, D, E, G, I, N, S, T, V |
| K | N | A, E, G, I, N, P, S, T, V, Y |
| N | N | A, F, I, K, M, P, Q, S, T, V |
| R | N | A, B, E, G, I, P, R, T, V, W |
| S | N | A, B, D, G, I, K, N, P, S, T, V, W |
Following residue effect: Examining the effect of the following (i+1) residue on residue i
The chemical shift averages are shown for residue i which are listed in rows. The first number is the chemical shift average value, the second number is the standard deviation, and the third is the number of shifts contributing to the average. Only those values determined by Student's t-test to be statistically significant in difference from the overall average for that amino acid is shown.
A residue i that has a row of filled values indicates an amino acid
that is especially prone to neighbouring effects at the i+1 position.
A nearly complete column of values would indicate that that particular
amino acid at i+1 exerts a strong influence on the amino acid at position
i. In summary:
| following residue i+1 | affected shift type | affected amino acids (i) |
| P | N | A, D, F, H, K,M, R, S, T, V |
| P | Ca | all amino acids |
| P | Ha | A, C, D, E, I, K, L, M, N, P, Q, R, S, T, V, Y |
| G | C' | A, D, G, I, K, L, N, S, T, V, Y |
| P | C' | A, C, D, E, G, I, K, L, N, P, Q, R, S, T, V |
| affected residue i | affected shift type | influencing amino acids (i+1) |
| E | Ha | B, C, D, E, G, P, Q, R, T, V |
The 'dipeptide' trends isolated from our database correlate well with those experimentally measured from polypeptides studied by Schwarzinger et al. suggesting that accurate chemical shift sets can be derived statistically in many cases. Again, trends can and should be verified with an increase in data.