L(-)-Glutathione, Oxidized (C20H32N6O12S2)
BMRB entry bmse000906
Entry DOI: doi:10.13018/BMSE000906
Data source: National Magnetic Facility at Madison - Francisca Jofre, Mark E. Anderson, John L. Markley
NMR-STAR file:
bmse000906.strNMR-STAR
interactive viewerStructure file (mol/sdf):
bmse000906.molAll files for
bmse000906Time Domain Data:
bmse000906.zipView the GISSMO record for this entry.
Sample and instrument details are given with the spectrum
Assigned chemical shifts
Set 1
Sample:
Conditions:
Spectrometer:
| Atom ID | Author Nomenclature | Value | Ambiguity Code |
|---|---|---|---|
| C9 | C2 | 56.8 | 1 |
| C1 | C6 | 28.98 | 1 |
| C3 | C7 | 34.1 | 1 |
| C11 | C11 | 55.3 | 1 |
| C7 | C14 | 41.39 | 1 |
| C5 | C17 | 46.18 | 1 |
| C6 | C22 | 46.18 | 1 |
| C12 | C28 | 55.3 | 1 |
| C8 | C30 | 41.39 | 1 |
| C10 | C32 | 56.8 | 1 |
| C2 | C37 | 28.98 | 1 |
| C4 | C38 | 34.1 | 1 |
| H57 | H43 | 3.77 | 1 |
| H41 | H45 | 2.16 | 1 |
| H42 | H46 | 2.16 | 1 |
| H45 | H47 | 2.53 | 1 |
| H46 | H48 | 2.53 | 1 |
| H59 | H50 | 4.75 | 1 |
| H53 | H51 | 3.14 | 1 |
| H54 | H52 | 3.14 | 1 |
| H49 | H54 | 3.77 | 1 |
| H50 | H55 | 3.77 | 1 |
| H51 | H58 | 3.77 | 1 |
| H52 | H59 | 3.77 | 1 |
| H60 | H61 | 4.75 | 1 |
| H55 | H63 | 3.14 | 1 |
| H56 | H64 | 3.14 | 1 |
| H58 | H65 | 3.77 | 1 |
| H43 | H69 | 2.16 | 1 |
| H44 | H70 | 2.16 | 1 |
| H47 | H71 | 2.53 | 1 |
| H48 | H72 | 2.53 | 1 |
NMR experiments
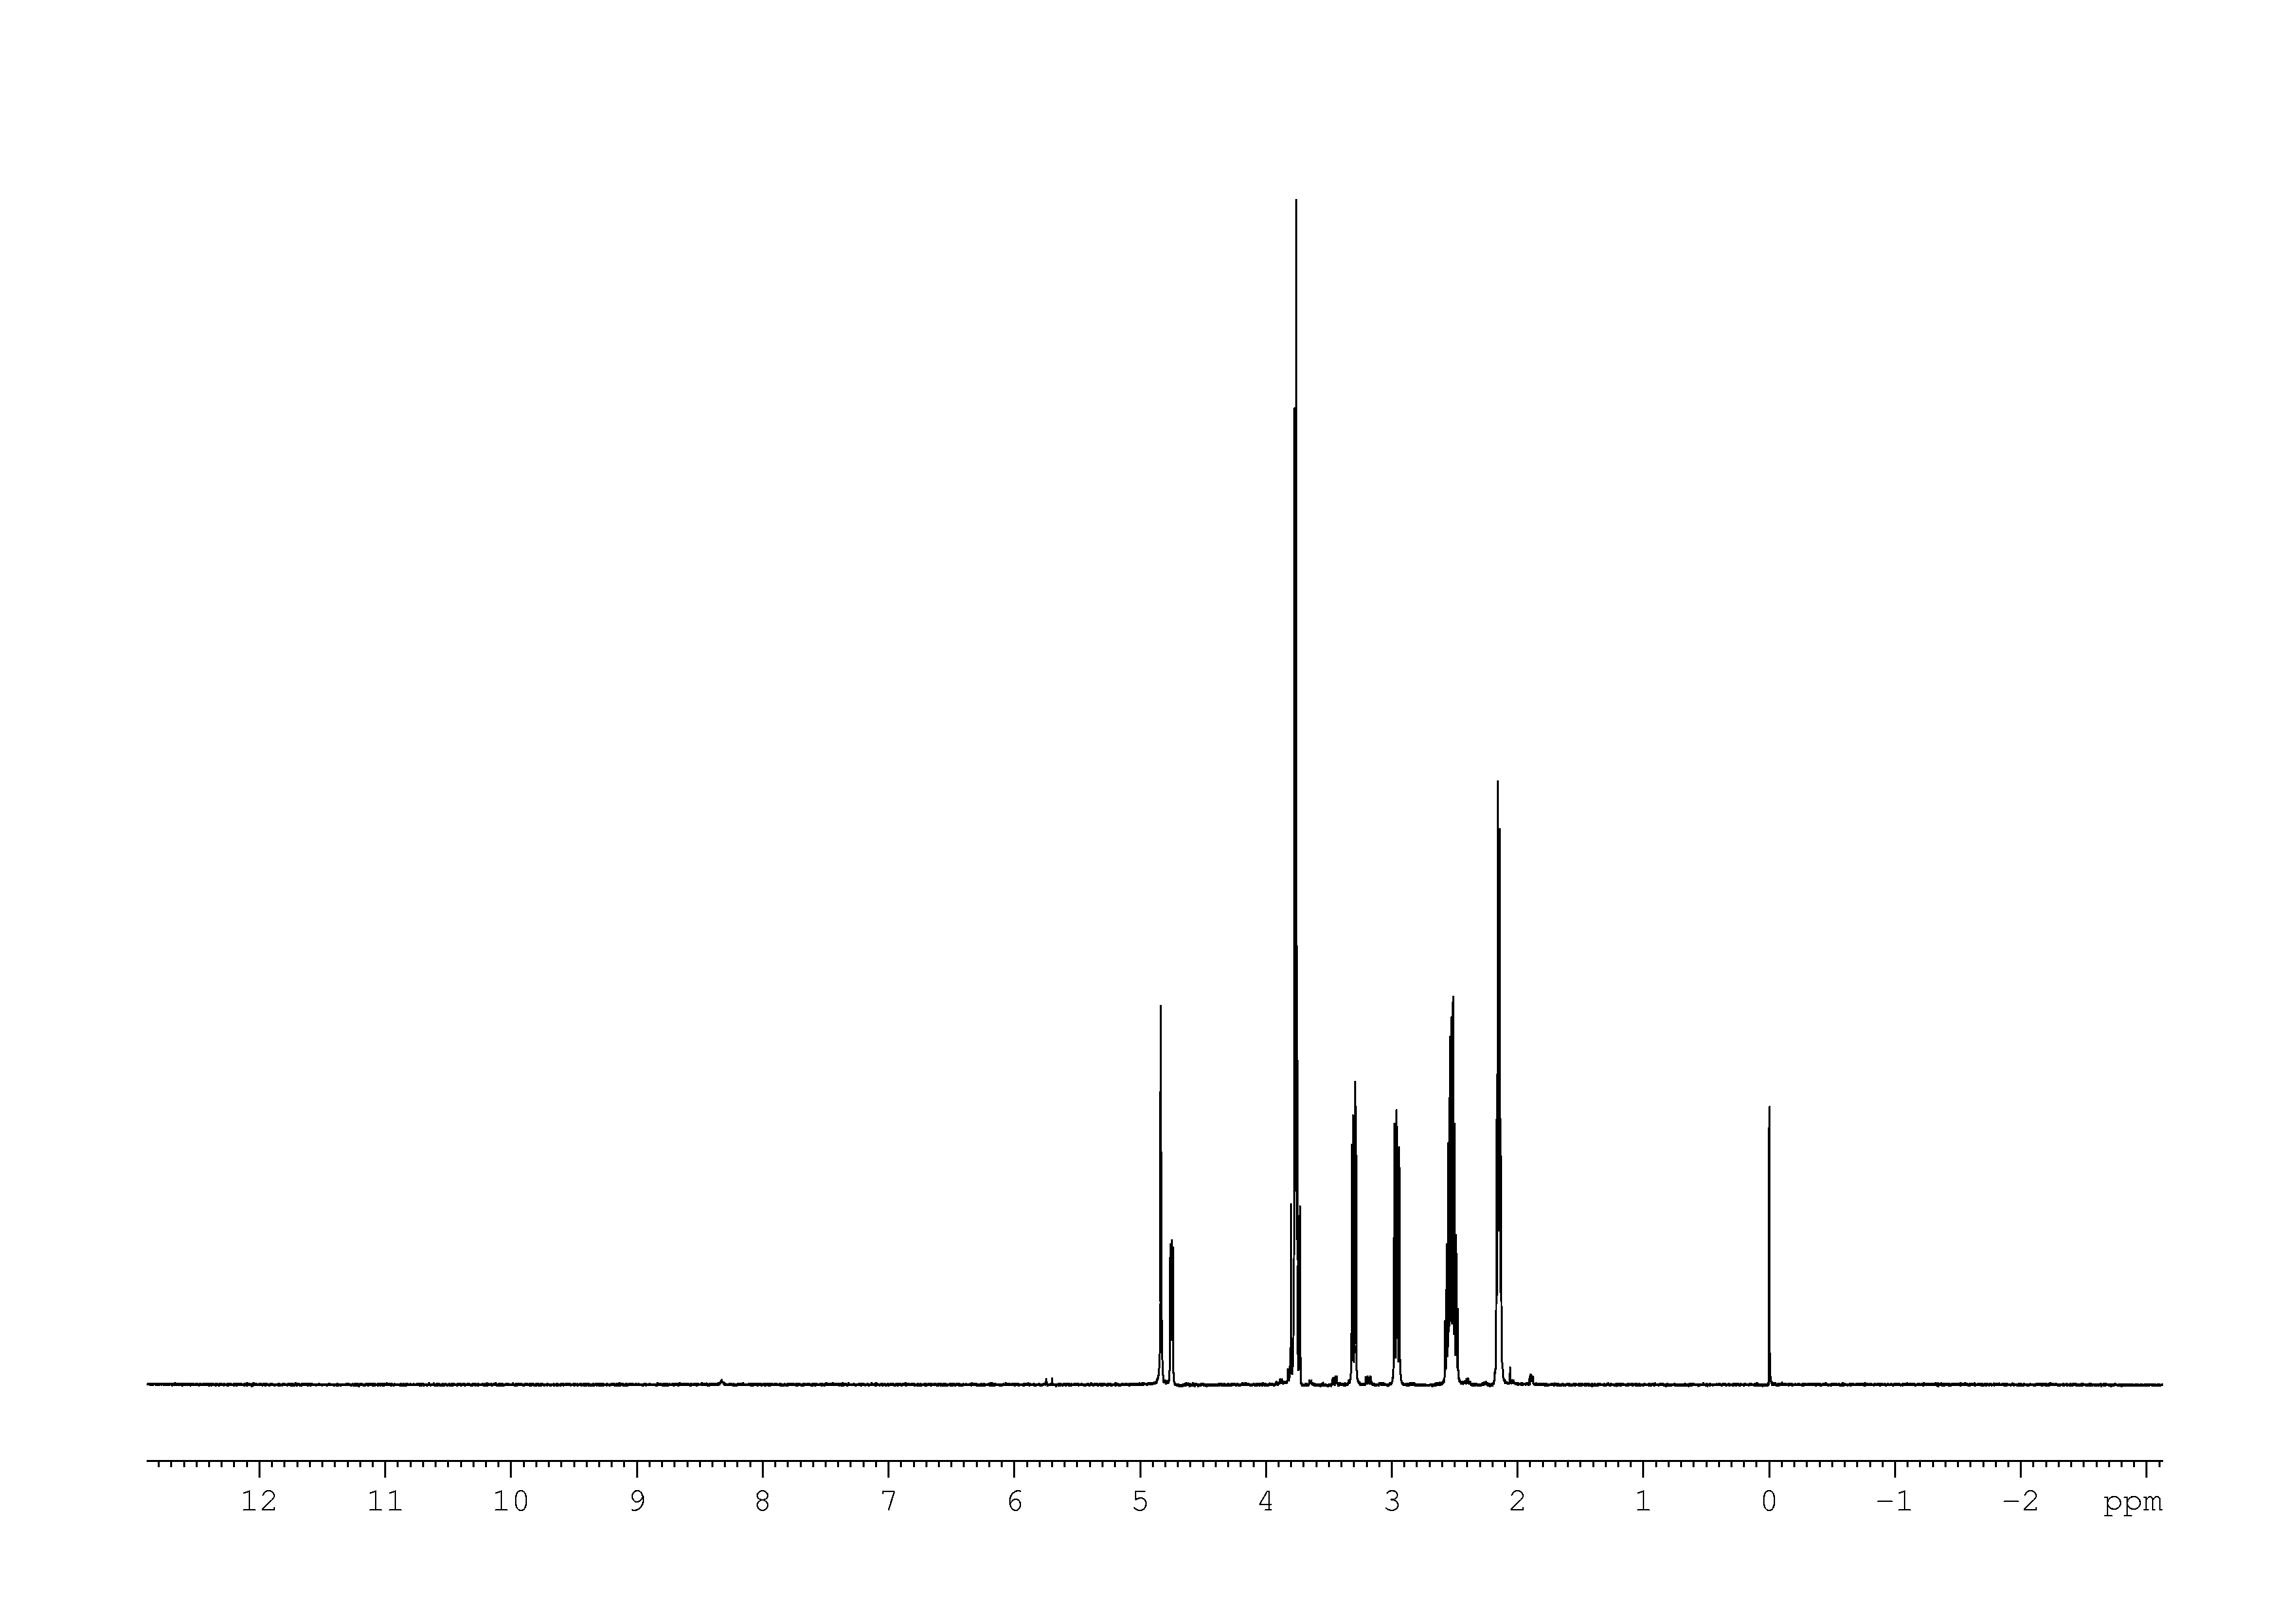
1: 1D 1H
Sample: 100mM in D2O, ref: DSS
Conditions: temperature: 298K, pH: 7.4
Spectrometer: Bruker DMX - 600MHz
2: 2D [1H,1H]-TOCSY
Sample: 100mM in D2O, ref: DSS
Conditions: temperature: 298K, pH: 7.4
Spectrometer: Bruker DMX - 600MHz
![Spectrum for experiment #2: 2D [1H,1H]-TOCSY](/ftp/pub/bmrb/metabolomics/entry_directories/bmse000906/nmr/set01/spectra/HH_TOCSY/00.png)
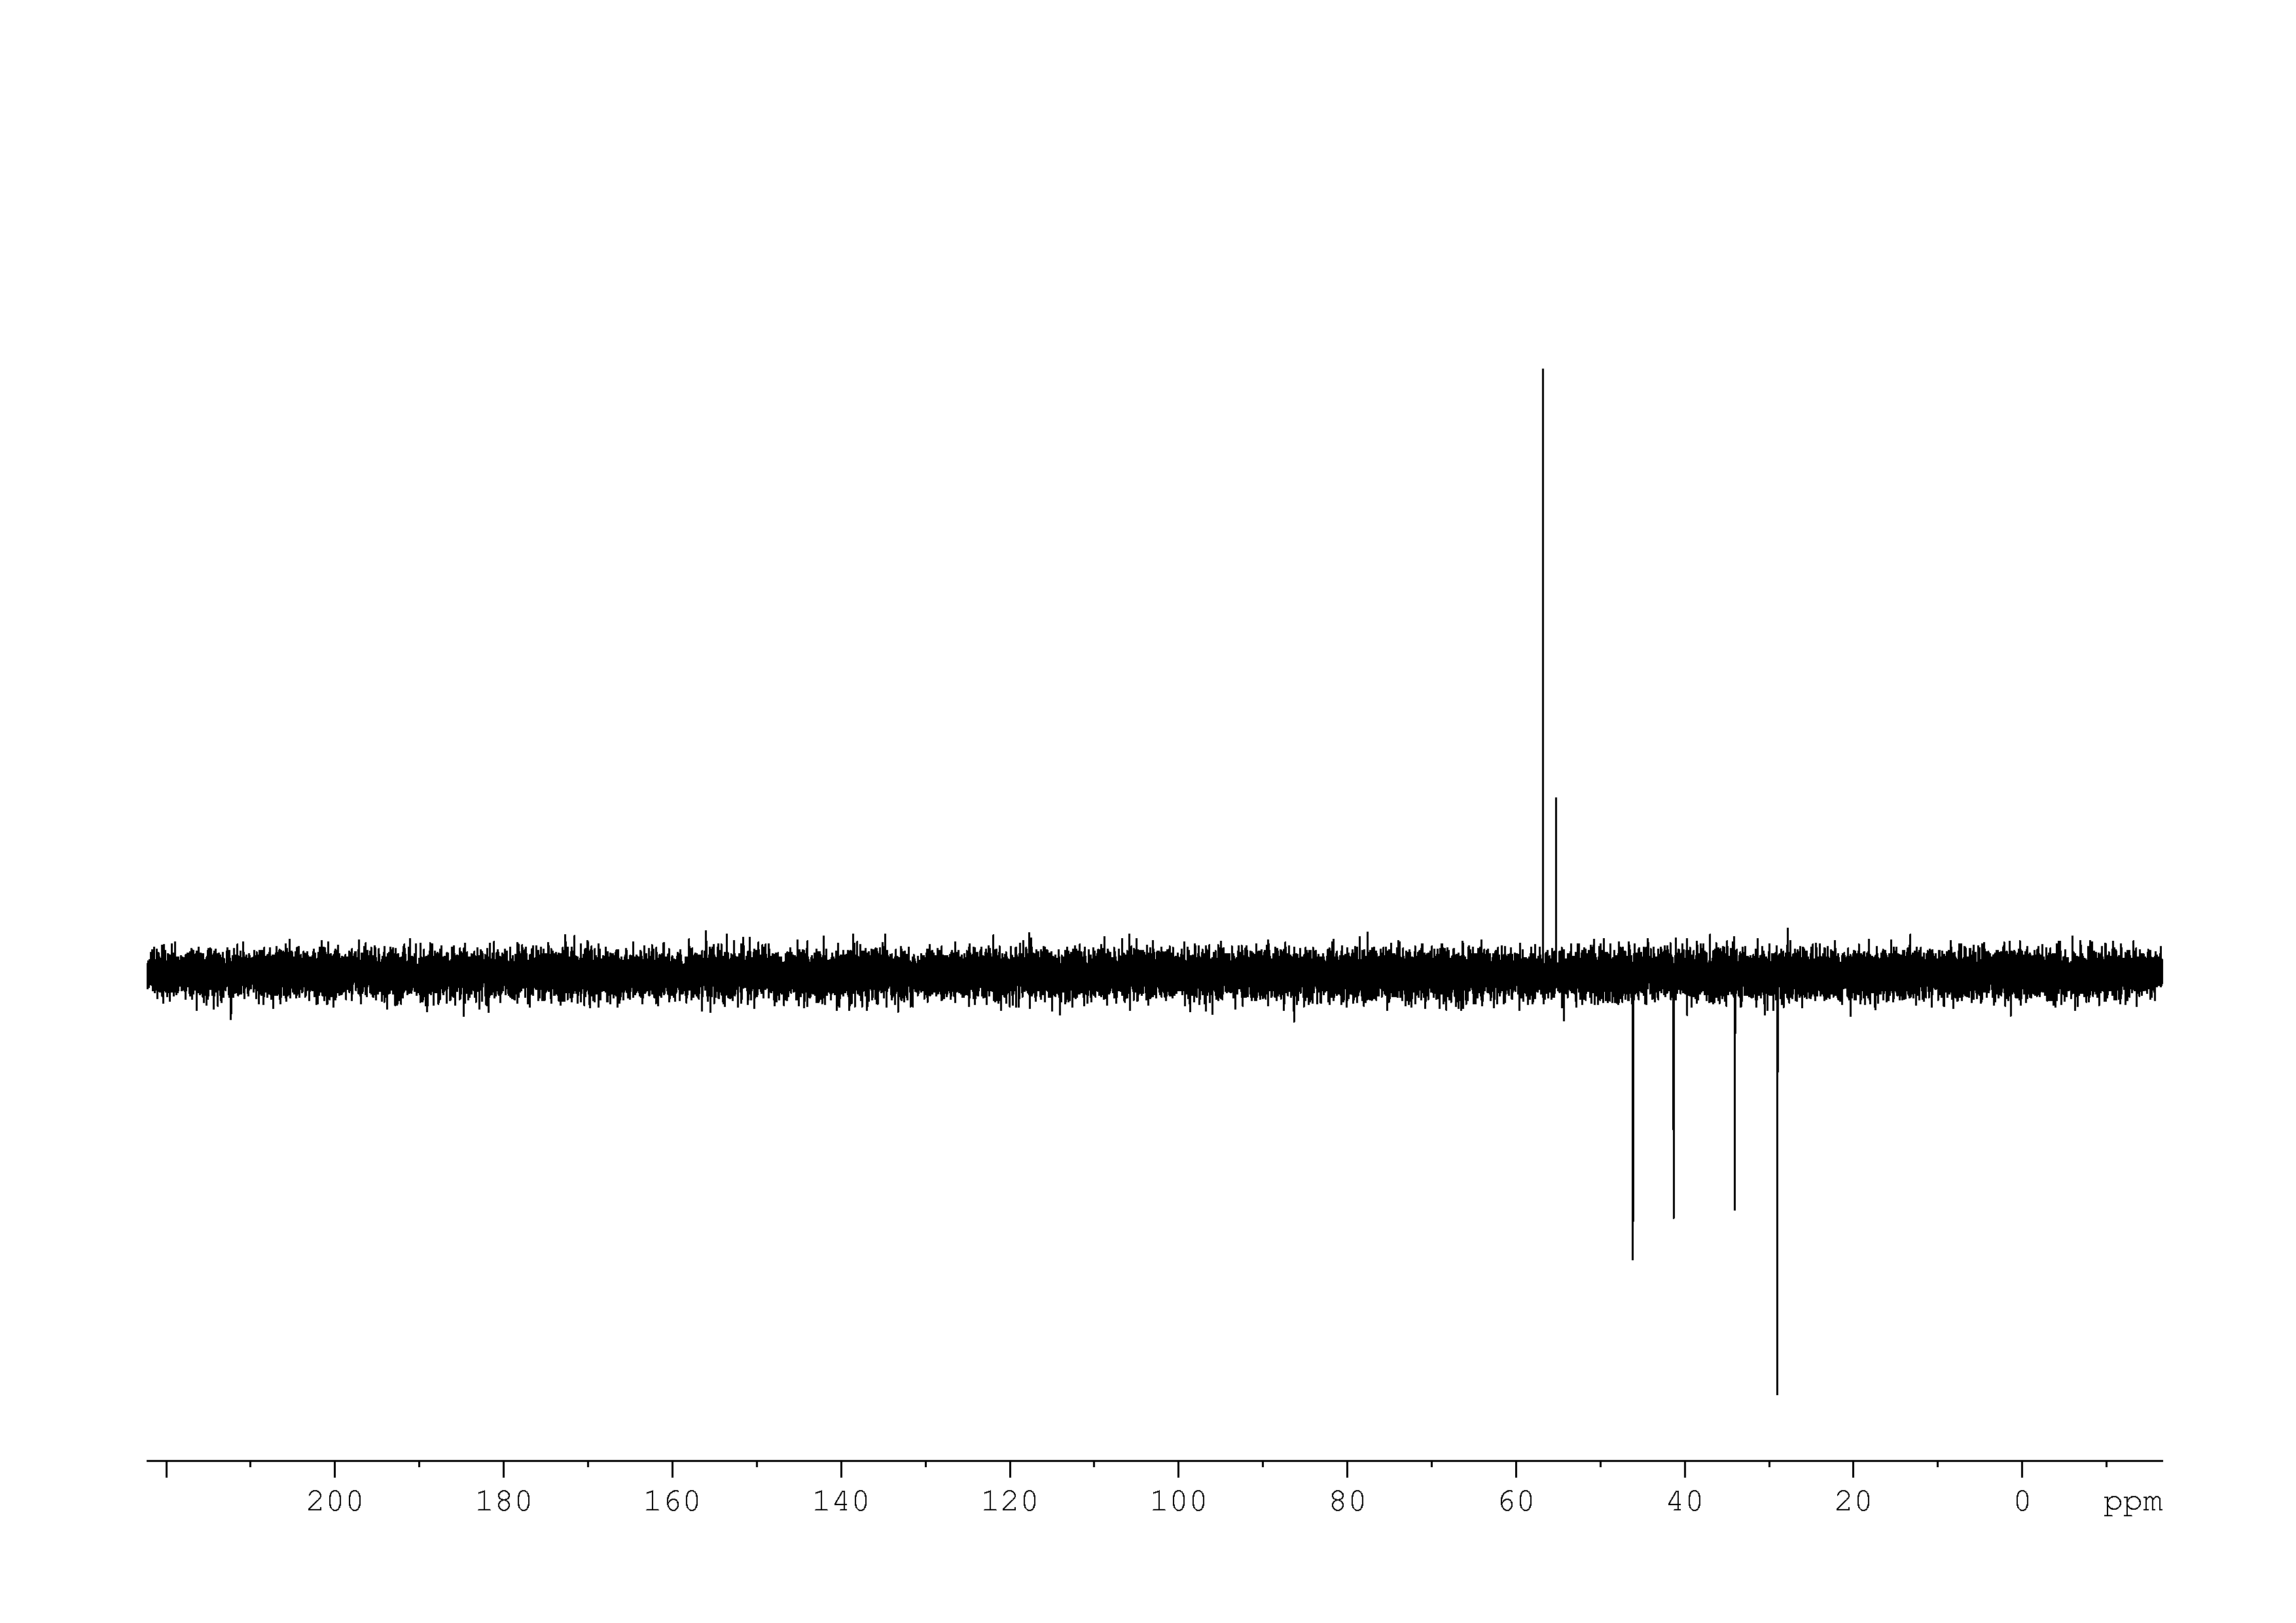
3: 1D DEPT90
Sample: 100mM in D2O, ref: DSS
Conditions: temperature: 298K, pH: 7.4
Spectrometer: Bruker DMX - 600MHz

4: 1D DEPT135
Sample: 100mM in D2O, ref: DSS
Conditions: temperature: 298K, pH: 7.4
Spectrometer: Bruker DMX - 600MHz
5: 2D [1H,13C]-HSQC
Sample: 100mM in D2O, ref: DSS
Conditions: temperature: 298K, pH: 7.4
Spectrometer: Bruker DMX - 600MHz
![Spectrum for experiment #5: 2D [1H,13C]-HSQC](/ftp/pub/bmrb/metabolomics/entry_directories/bmse000906/nmr/set01/spectra/1H_13C_HSQC/00.png)
6: 2D [1H,13C]-HMBC
Sample: 100mM in D2O, ref: DSS
Conditions: temperature: 298K, pH: 7.4
Spectrometer: Bruker DMX - 600MHz
![Spectrum for experiment #6: 2D [1H,13C]-HMBC](/ftp/pub/bmrb/metabolomics/entry_directories/bmse000906/nmr/set01/spectra/1H_13C_HMBC/00.png)
7: 2D [1H,1H]-COSY
Sample: 100mM in D2O, ref: DSS
Conditions: temperature: 298K, pH: 7.4
Spectrometer: Bruker DMX - 600MHz
![Spectrum for experiment #7: 2D [1H,1H]-COSY](/ftp/pub/bmrb/metabolomics/entry_directories/bmse000906/nmr/set01/spectra/HH_COSY/00.png)
8: 2D [1H,13C]-HMQC
Sample: 100mM in D2O, ref: DSS
Conditions: temperature: 298K, pH: 7.4
Spectrometer: Bruker DMX - 600MHz
![Spectrum for experiment #8: 2D [1H,13C]-HMQC](/ftp/pub/bmrb/metabolomics/entry_directories/bmse000906/nmr/set01/spectra/1H_13C_HMQC/00.png)